Transforming AI backend solutions into Data Visualizations for International Governments
How to transform complex back-end geo-spatial intelligence into a SAAS service that requires little time-investment to understand complex data changes and relationships?
SkyMap Global, is a unique Geospatial Information System (GIS) product, powered by EoFactory, that provides accessible machine learning and artificial intelligence analytics. In the pursuit of sustainable development, our platform helps international governments and companies create actionable, sustainable solutions focusing on democratizing satellite data with easy-to--understand platform visualizations.
- https://www.aetosky.com/ -https://skymapglobal.com/ - https://eofactory.ai/
Project overview
+ Results
the Goal
1) Rebrand and transform backend product into custom product
2) Design customer friendly front-end interface
3) Automatically report measured areas of cover loss and alert change statistics and trends
My role
UIUX Developer. Information architecture, UI UX design, production, content strategy.
Results
-
16% increase in positive load feedback
-
20% increase in conversion rate
-
36% decrease in churn
background
Many countries around the world are looking to remote sensing to solve many of its though issues, like deforestation, air pollution, disaster management, and urban planning. The remote sensing market is growing exponentially, with increasing demand for micro-satellite is growing. As the cost of launching micro satellites in space is drastically reduced, there becomes an abundance in satellite imagery and data to be collected, with a shortage of data analysis.
Existing GIS softwares are not custom solutions. Oftentimes, the GIS companies provide a complex back-end product that confuses users. Functionalities are not fully understood and utilized, with immense time investment required to operate. Furthermore, due to a lack of affirmative feedback loop in data reporting, users spend 43% more time and money on deploy surveying manpower and resources, to conduct real time confirmation activities.
Market Issues
I conducted a brainstorming workshop with the team to understand the problem’s pain points.
Monitoring large and geographically dispersed areas presents significant challenges for mining companies. Local undocumented mining can quickly generate “tail-risk” that has the potential to disrupt operations due to social and/or legal setbacks. The traditional method to monitor mining activity is by outsourcing drone survey services to collect landscape-level image data. However, this type of practice presents many issues:
Governments need to monitor large areas of land to note for changes + track unauthorized activity
Traditional methods of drone surveillance is very expensive, especially over entire countries' landmass.
Exponential increase in price of drone surveillance + on ground Quality Control, along with monitored land size.
Data reported is not real-time with manual operations needed to attain changes + feedback + discern trends + detect risk.
Data does not show relationship trends. Governments need to train or obtain
resources for additional data processing.
what are the challenges faced by customers
using existing gis solutions on the market?
challenge 1
The traditional GIS Mapping tools require a considerable amount of time to learn. Furthermore, creating , analyzing and managing data with the extracted information with a wide array
of tools require a certain amount of studying and practice.
Manual labor is needed in the data analyzing process.
time consuming
challenge 2
Despite advances in technology providing a surplus of satellite imagery, data that is obtained is not linked to show overarching connections. Limitations in machine learning and artificial intelligence technology prevent most companies from deriving actionable insight from their satellite data.
no actionable data
understanding the user
-
User Research
-
Persona
-
User Journey Map
-
User Flows
To create the architecture of the configurator, we asked our users to define the most important objectives they have in mind when they are looking when they purchase GIS Remote Sensing software.
desire 1
quick overview of statistical + map data
desire 2
auto generated updates on changes + monthly and yearly trends
research
The creation of competitive profiles (in terms of marketing strategy, target market, core business, usability, layout, navigation structure, compatibility, content, design and performance) together with SWOT analysis helped to assess current offers in this area. As a starting point, we did some competitor research to investigate the current market offerings and draw inspiration from specific features that we liked about existing GIS Software platforms.
Also, general advantages and disadvantages of dashboards and the question of how visualization dashboards could be integrated into the context of conventional on ground monitoring QC was an important part of the research.
Resource Intensive, high effort requirements for both training and management of systems.
company product performance
EoFactory existed as a GIS software platform that analyzes and extracts information from user's own data, purchased data or public satellite image data. It focuses on heavy AI and ML tools for processing data to be ready for analysis. As a very technical software service, a high level of time and training is needed to familiarize users with the system. However, most clients did not understand the wide range of functionality that EoFactory offers, as many clients did not need the full comprehensive range of tools, and a lot of resources was needed to upsell and educate clients on use cases. In addition, the lack of affirmative feedback Quality Assurance causes users to spend more time and money on deploy surveying manpower and resources.
Too many tools, no direct solution offered to client. Client can easily be confused or lose out on functional benefits.
Lack of QC leaves the data assurance loop open. Clients need to coordinate their own resources on ground.
weakness 1
weakness 2
weakness 3
How to better sell eofactory gis solutions?
Instead of selling a wide range of tools, we wanted to sell
issue-specific products, with tailored subscription for range of selectable functionalities, including QC. This takes the effort away from data scientists and reduces need for processing and technical resources.
sell custom product
idea 1
data dashboard
idea 2
Selling pre-built pre-designed dashboard tools allow for simple and clear visualizations of data and data relationships. This makes the process of absorbing and delivering data more efficient. Clients will be able to see clear trends and pointing out anomalies without any training.
thus we create a new product: skymap global
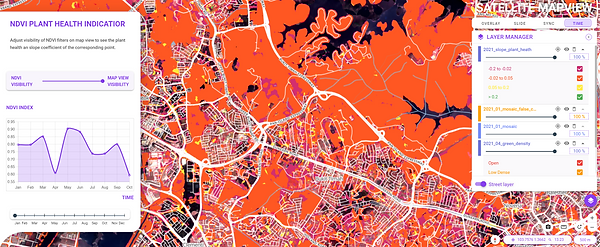
We created the SkyMap Global Dashboards to provide high-resolution remote surveillance and insightful analytics in one, seamless, platform, allowing Governments to receive timely updates on key insights, anomalies and automated change-detection without much time and effort invested. This allows for comparative data analysis, early detection and response to issues, empowering Governments to focus more on decision-making, creating actionable plans based on insights, and realizing outcomes.
Multiple Sources
of Client Data
Data Creation +
Processing+ Machine Learning + Interactive AI
EoFactory
Processing
Overview
Dashboard
Map View tools + Satellite Capture
Monthly Report + Relationship Trend
Quality Assurance Verification Module
Planning
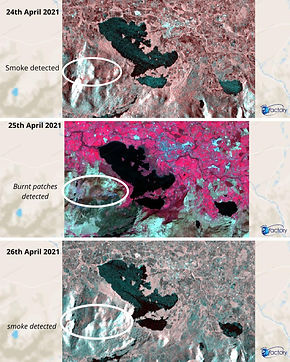
The Plan was to create an easy-to-use front-end platform for change detection using up-to-date satellite imagery powered by EOfactory. This goal of the application is to automatically measure the area of cover loss and alert change statistics and trends. With this platform, our client will save time and money that would have been used to deploy surveying manpower and resources.
Platform capabilities: Remote monitoring, automatic change detection (vegetation/non-vegetation), daily/monthly changes (depending on data subscription), cloud cover removal using mosaic and AI.
persona
Using the quantitative and qualitative data from interviews and survey results, I defined the three target group profiles Kevin (Data Analyst Rep, 35) and Akmal (Student, 22) to better empathize with my main user groups and prioritize goals according to their needs.

Training AI Machine Learning Models

Changes & Comparative Statistics
The Client uses the right section of the Dashboard to input data in Key Monitoring Parameters
Visual Layers
Visual Layers on the left track changes over time and area, allowing for visual comparison and trend monitoring
Drill Down

In depth view
Throgh the map and chart on the right, clients can zoom into specified areas, dates or traits, to filter data for greater clarity.
Project Management tools

Easy Layer Control & Management
Client can input time parameters and choose corresponding data sets over periods of time.
Responsive filter
Ability to arrange datasets flexibly, sorting by month and by data type.
ways of comparison- Custom for Nparks
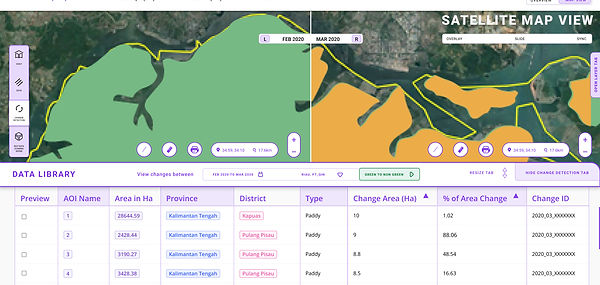
Slide to see change
To view changes in forest cover, we developed custom comparison functionality. Clients can view changes with the SLIDE or SYNC view modes, highlighting visual comparison.
Quality assurance - Custom for nparks
Link effort with local
on-ground verification
Using this Dashboard, users can merge and view data gathered from on ground monitoring teams, forming a good system of comparative analysis and records.
Ai System Learning
On the back end, the Ai learns from differences between on ground site reports and satellite imagery, allowing for more accurate data and proposal of actionable solutions.
Based on the insights gained from the initial content audits, competitor analyzes and Card Sorts with potential users, I defined the sitemap for SkyMap Global and then evaluated it via tree tests with potential users.
paper prototyping
.jpg)
.jpg)
Wireframing,
Prototyping
& Usability-Testing
With low-fidelity prototypes, the planned dashboards and the general structure of the application could easily be tested in usability tests. Without much effort, adjustments could be made before going into the much more costly digital implementation.
testing interactive prototypes
Building a demo we could do user testing and refine the user experience process.
User feedback from agency users around the world made us more aware of the regional differences in needs and prioritized information.
It should be noted that this project was accompanied by a one-month internal user training, followed by a fixed course plan and a digital implementation was planned. It helped government entities deepen knowledge in key sustainable measures and to explore approaches to digitization monitoring and to find out how impulses for modern learning can be set in accordance with the sustainability goals.