Empowering Better Workforce Decisions: Transforming HR Analytics with Panalyt
How to transform the HR-CRM space? Targeting the lack of tailored, focused analytic products, and a lack of resources for HR teams to learn data analytics, we designed an easy-to-use software that tracks data changes at a glance.
Panalyt, Panalyt is a unique workforce analytics tool that aims to drive better people decisions through visualizations of integrated HR data and analytics — www.panalyt.com
Project overview
+ Results
the Goal
Improve user experience (design) in Dashboarding software, visually chart and represent changes in HR data in easy to understand, real time dashboard reports, to drive better people decisions through instant, coherent visualizations of integrated HR data and analytics
My role
UIUX Designer designing user flow, visualization dashboards and information architecture. Conduct research, wireframes and mockups as well as high fidelity prototypes and marketing campaigns.
Results
-
80% increase in Recruitment Efficiency
-
25% increase in Business Productivity
-
50% decrease in Attrition
responsibilities + reception
2020 Excellence Award winner in the Analytics Service Category at the 5th annual HR Technology Awards sponsored by the Japan Ministry of Economy, Trade and Industry on July 31.
I was designer on the team alongside 1 UX Engineer, 1 business analyst and 4 engineers. Some key achievements listed below:
Applied design sprints to inform our process. In Scrum environment, I was able to effectively apply design sprints process to identify the problem, ideate on the solution, prototype and develop final production-ready HR prediction tools, that identify and reduce staff turnover in client companies by over 40%.
Tested & Executed end to end. Developed and A/B tested HR employee attrition solutions that resulted in an 50% decrease in Attrition rates.
Represented the company in the international TechHR Conference 2019. Conducted over 200 sales pitches for client acquisition and retention, including pitches to TATA, India’s biggest industrial conglomerate.
background
For a HR executive, actionable current employee data analytics is the elephant in the room. My team's market research shows the challenges faced below.
challenge 1
Many HR executives are not trained in data analytics, and thus conventional data analytics requires a collaborative effort with IT departments or external consultants.
Resource intensive
to train/outsource
Often, by the end of the lengthy anonymization process, the data is not reflective of the real-time situation, and is no longer accurate for company predictions and analysis.
lack of real time, accurate results
challenge 3
challenge 2
Due to limitations in data confidentiality, HR has to manually anonymize raw data from different systems before working with IT or consultants to build dashboard tools.
Time consuming
challenge 4
The anonymized data sets are also unable to be drilled down into an individual employee's level, making it impossible to accurately measure performance and attrition.
lack of depth
To get time-sensitive HR data and learn more on relational analytics within an organization, we created the Panalyt product as a comprehensive easy to use solution, allowing HR to receive timely updates on key People Metrics and Insights without much time and effort invested.
This allows for comparative data analysis, early detection and response to issues, viewed across time or segmented by any attribute you want.
understanding the user
-
User Research
-
Persona
-
User Journey Map
-
User Flows
I conducted a brainstorming workshop with the team to uncover pains felt by HR departments. It was revealed that HR teams wished for:
desire 1
HR managers wanted to check the most important personnel indicators and changes immediately, to get a time accurate overall picture of the organization.
CONCISE OVERVIEW FROM DIVERSE DATA SOURCES
desire 2
risk alert+
prediction
Organizations want to detect trends and address risk of reduced engagement in attrition, performance or relational analytics even before the individual parties become aware of it.
research
We looked into the benefits and drawbacks of dashboards in general, as well as how visualization dashboards could be integrated into traditional on-the-ground QC. As a starting point, we did some competitor research to investigate the current market offerings and draw inspiration from specific features that we liked about each app.
competitive analysis
Resolving solution- offer ready mades
New SaaS tools like Tableau and Power BI are popping up everywhere In the HR analytic space. These tools focus on building completely custom dashboards that analyze all sorts of HR employee performance statistic data for each company's unique needs.
Tableau case solution can be streamlined and offering preset Tool-based marketing. This reduces per-unit cost, reduces indecision and churn in the purchasing process, and allows Tableau case solution to be offered at a lower cost to rate sensitive customers.
Building custom dashboards from scratch is resource and time intensive, as data structures need to be designed and processed by a team made up of Human Resource Managers, Data Scientists and Data Designers.
weakness 1
Consumers do not have a strong understanding of product features due to diverse applications and use cases. Targeted advertising and outreach efforts are required to raise product awareness and increase sales.
weakness 2
Putting Managers and HR Partners on the same page
product concept
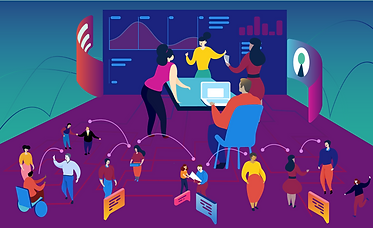
Panalyt takes a strong visual approach in representing and communicating HR issues, allowing managers and HR to be able to understand complex data trends in once glance without the need to do any analytics.
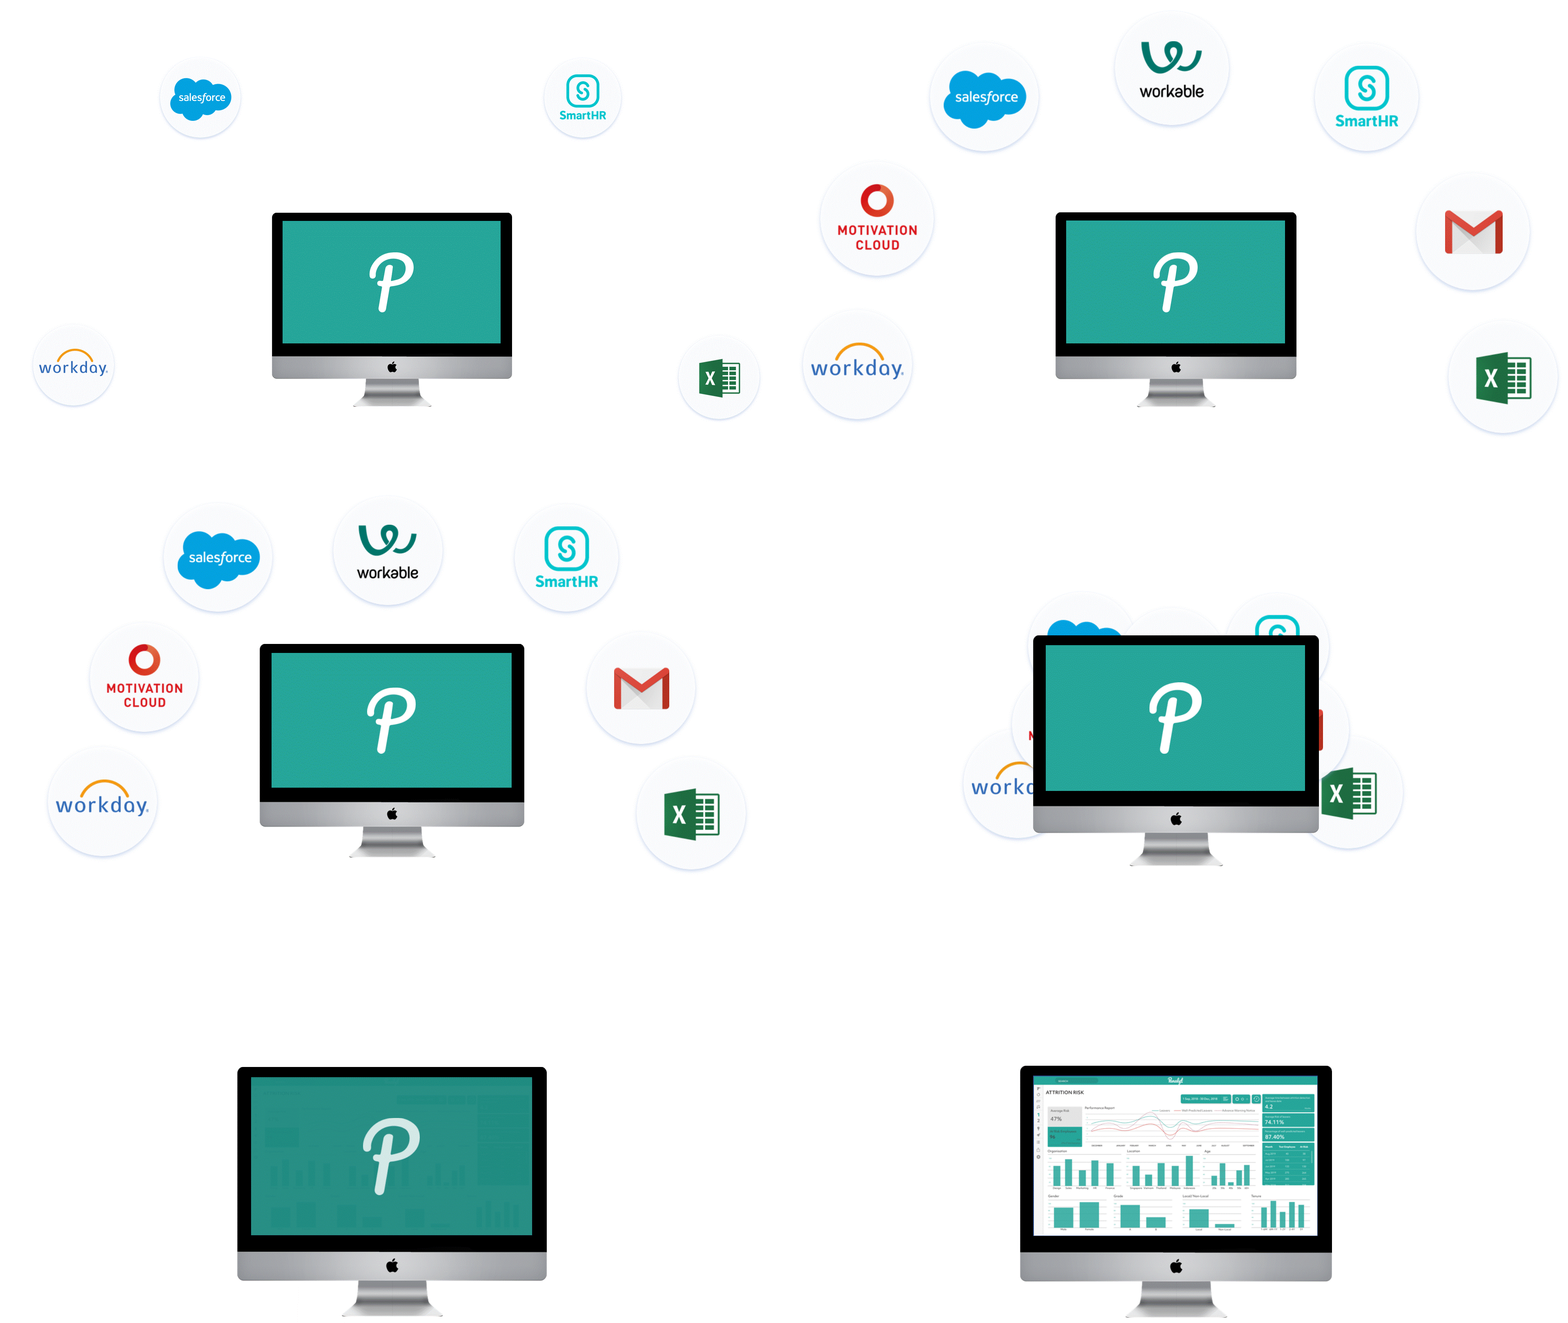
Simple user friendly interface that integrates data from all sources, sorts and illustrates HR analytics
Translate complex HR problems into visually quantifiable, customizable analytic dashboards.
System of visual benchmarking to compare and predict change against real time market standards.
Visually chart business performance and trends, obtain forecast and updates to drive actionable change.
NEW USER SETUP
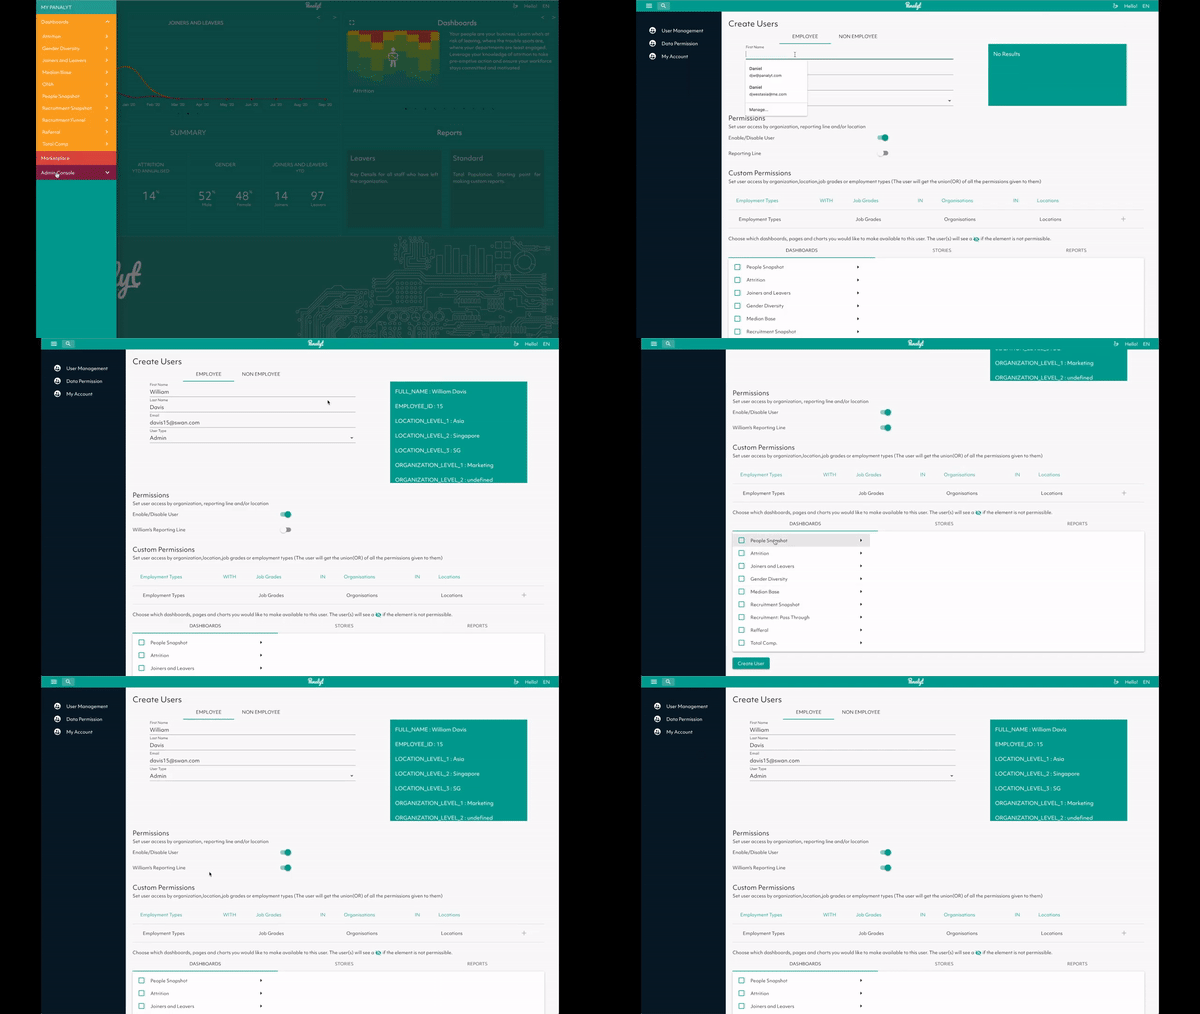
Admin Console
Add new User + Search for Active Employees.
Responsive Selection
Ability to enable or disable employee. Visual indication of selection.
landing page
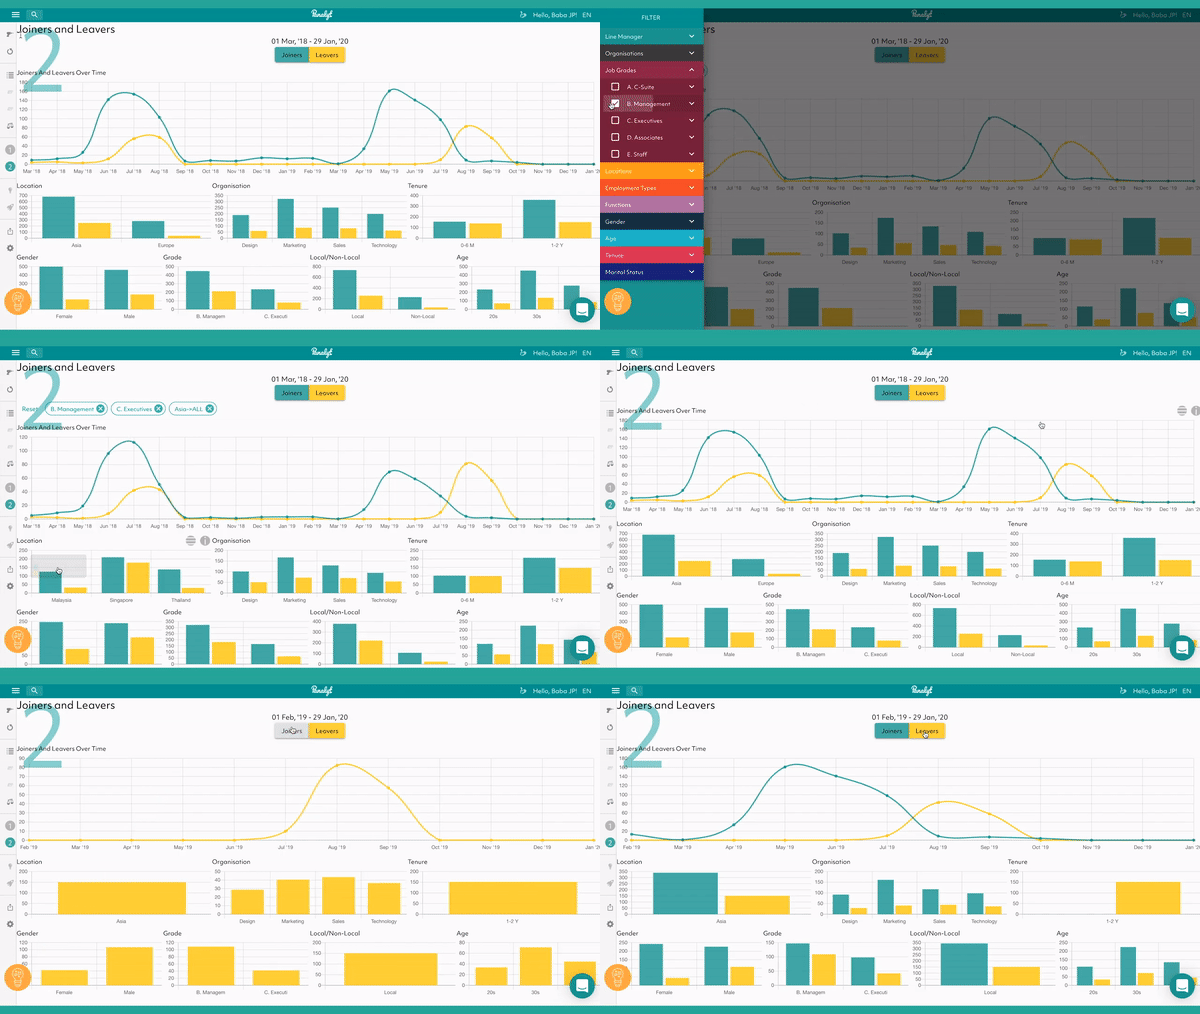
Landing Dashboard
Summary data for Manager's quick overview. Chart showing trends and values
In Depth Analysis
Data points from multiple sources can be brought together, drilled down and customized to focus on key metrics.
report generation
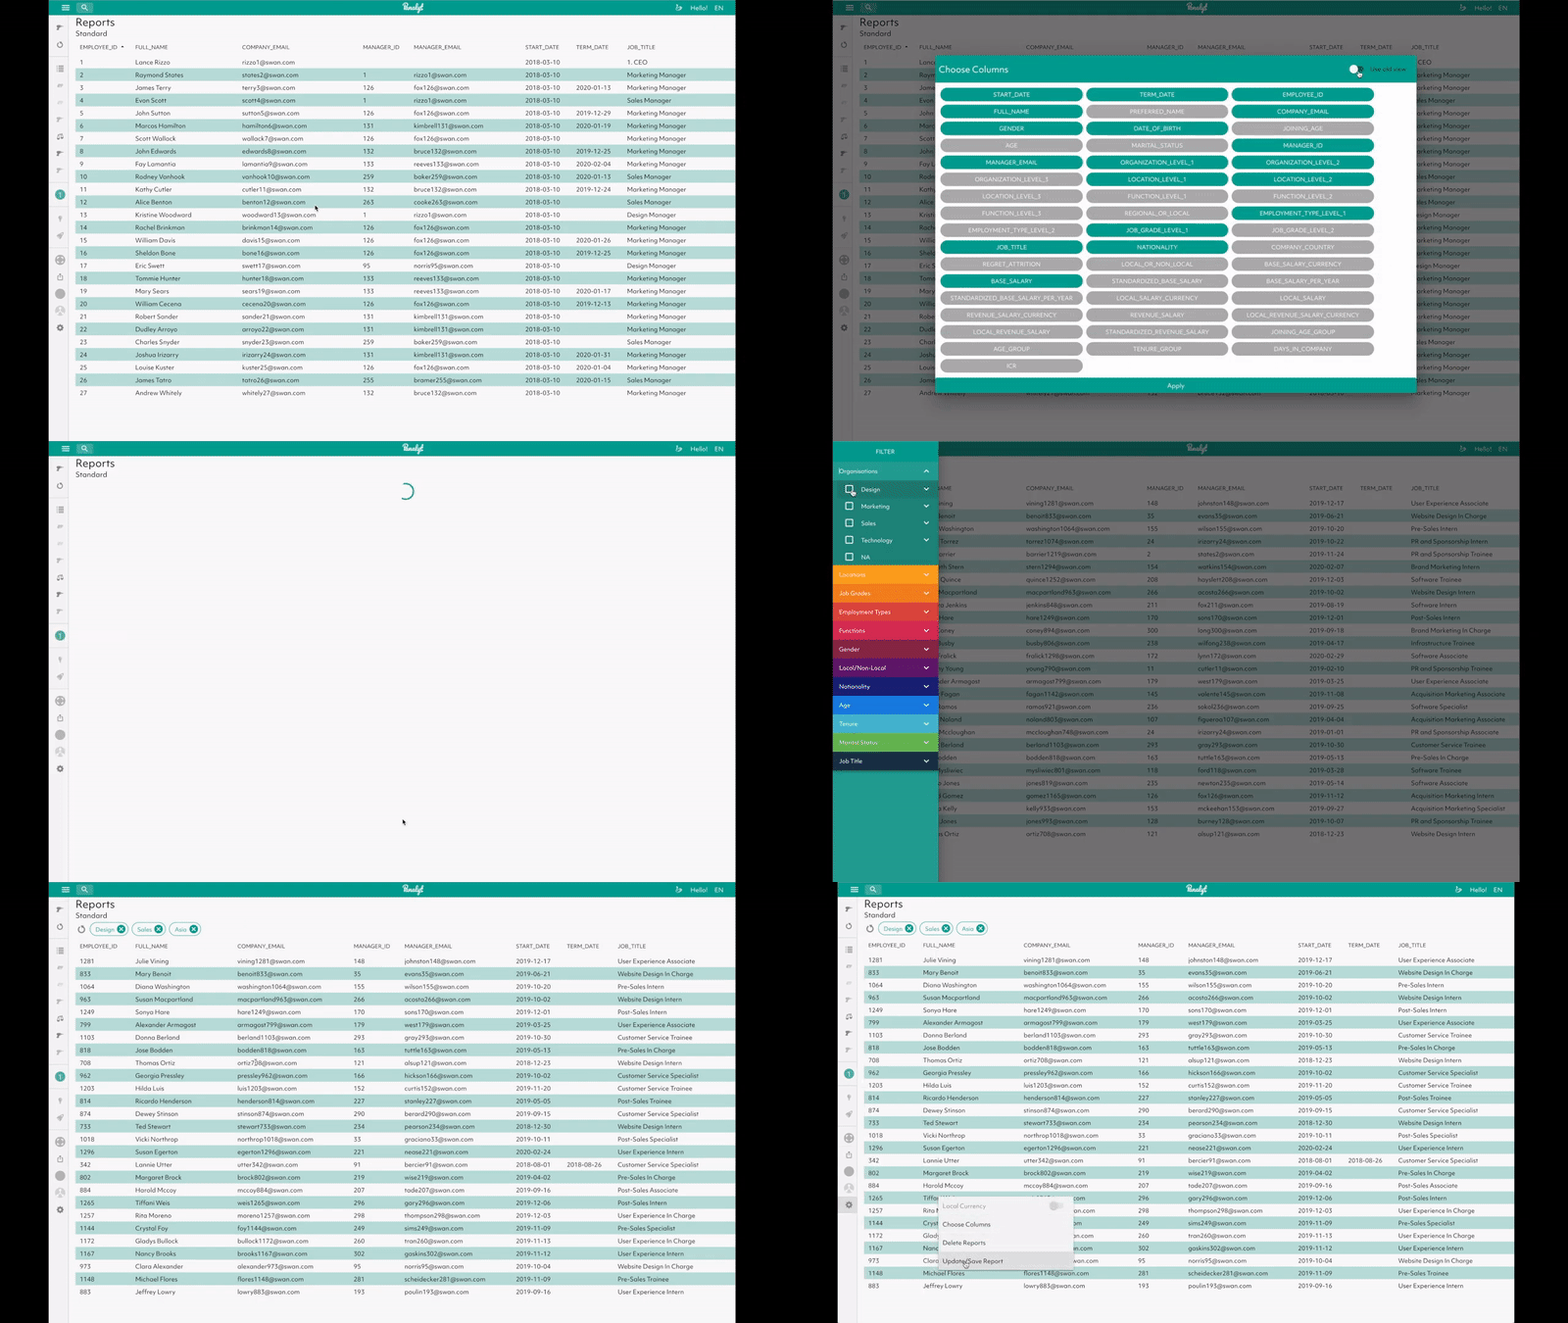
Targeted Reports
Managers can quickly access integrated data through excel style data report.
Search Function
Use filter bar to drill down into particular selection for easy export to excel or g-sheet. Or save selection filter as a template for future use.
dashboard
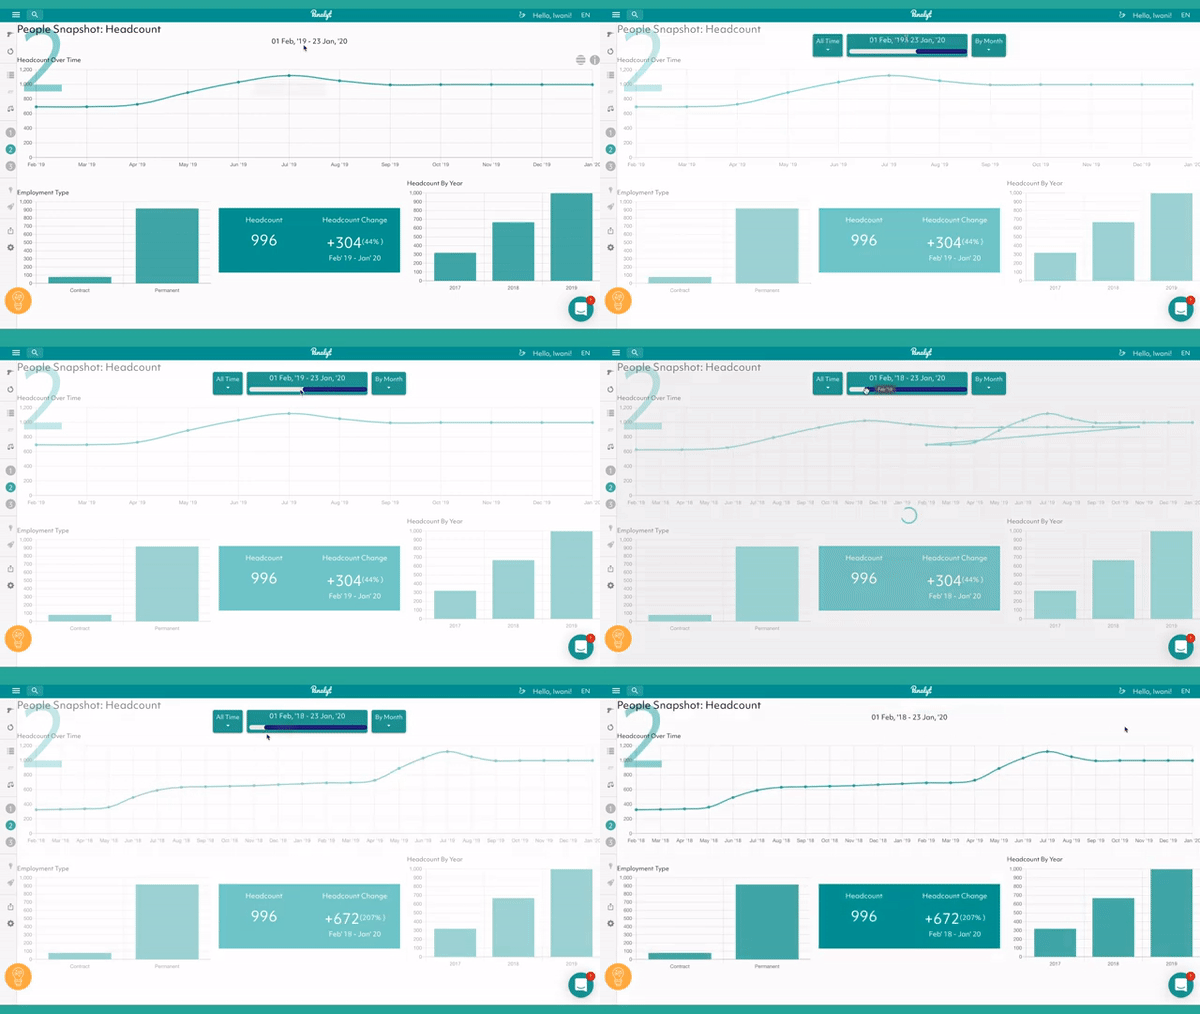
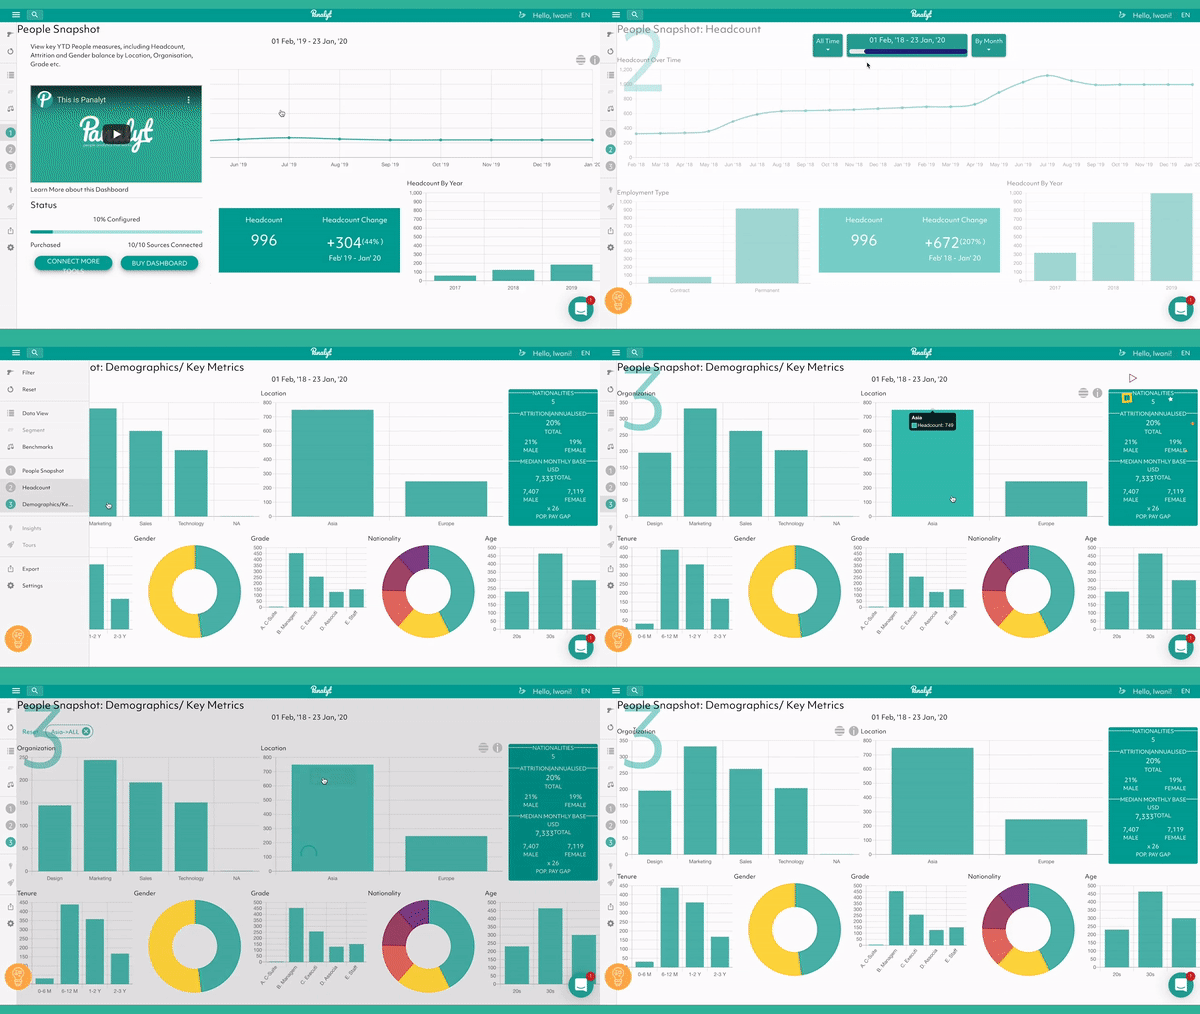
Dashboard Home
Home page acts as a guide, explaining functions of subsequent multiple pages of charts and analytics.
Modifying timeframe
Allow user to add labels here and modify the time frame of the data in the time slider. Data adjusts and charts update with slider movement. User can also enter preset periods, eg. year to date.
Drill into Charts
Clicking on any chart filters the population and allows managers to see the details.
Real Time Update
Dashboards are automatically populated with latest data, reducing manual effort and eliminating need for active management.
Based on the insights gained from the initial content audits, competitor analyzes and Card Sorts with potential users, I defined the sitemap for Panalyt and then evaluated it via tree tests with potential users.
Information architecture


Wireframing, Prototyping
& Usability-Testing
With low-fidelity prototypes, the planned dashboards and the general structure of the application could easily be tested in usability tests. Without much effort, adjustments could be made before going into the much more costly digital implementation.

Clickable prototypes
After prototyping adjustments, wireframes, mid- and high-fidelity prototypes were created, which I supplemented with clickability using AdobeXD. Again, user tests revealed small vulnerabilities in the structure of the user interface, in some formulations and interactions. In addition, the users asked smart questions, which led to further improvements.
To quantitatively review the usability assumptions, I did A/B and click tests, which confirmed my assumptions except for a few details. First and foremost, I tested the navigation structure on tablet and mobile, the wording of some actions as well as preferences regarding the visual design.
